Sales Performance

Track total sales, product revenue, inventory turnover, and more.

Smart Dashboard - Sales Performance Dashboard

This sales performance dashboard provides a detailed breakdown of key data sets. With this dashboard, we can answer the following questions:

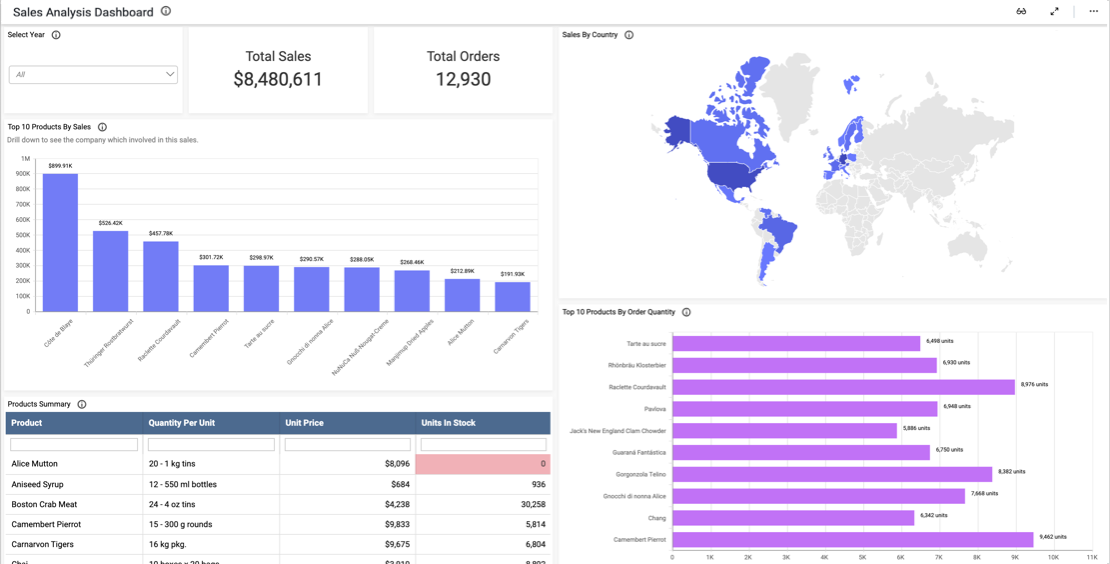
  • Firstly, what are our total sales numbers?
  • How many products have we sold?
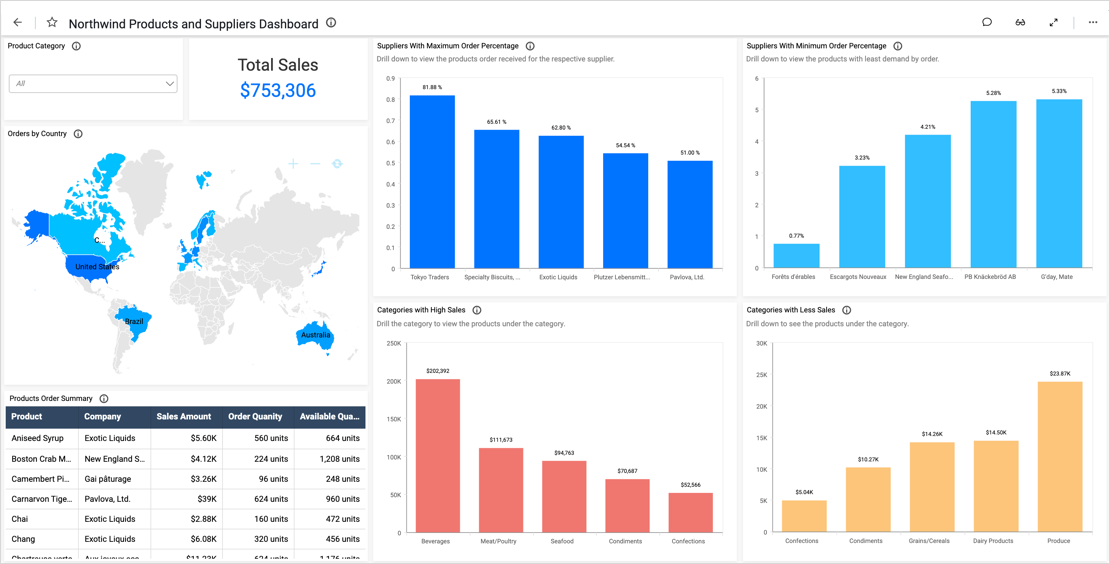
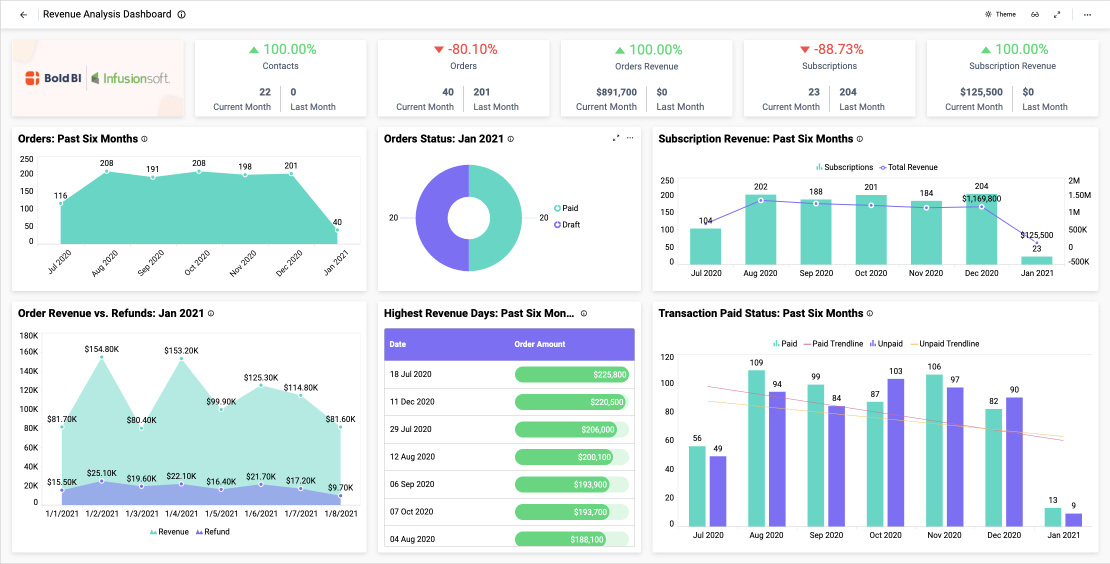
  • Which products bring in the most revenue?
  • Finally, how do this year’s sales numbers compare to last year’s?

Track Daily Operations and Analyze Broader Trends

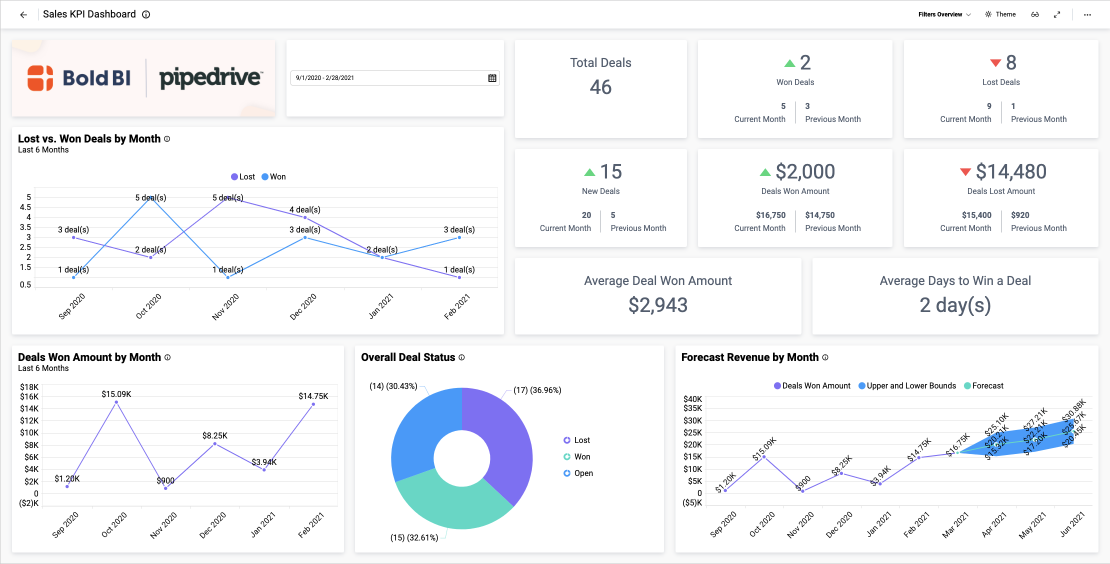
By tracking metrics such as total sales and products sold, leaders can ensure that teams are achieving big-picture goals. We can easily see this data by viewing the card widgets. However, by reviewing the sales distribution spline chart, we can also compare this year’s numbers to last year’s, allowing the team to track its progress in any given month.

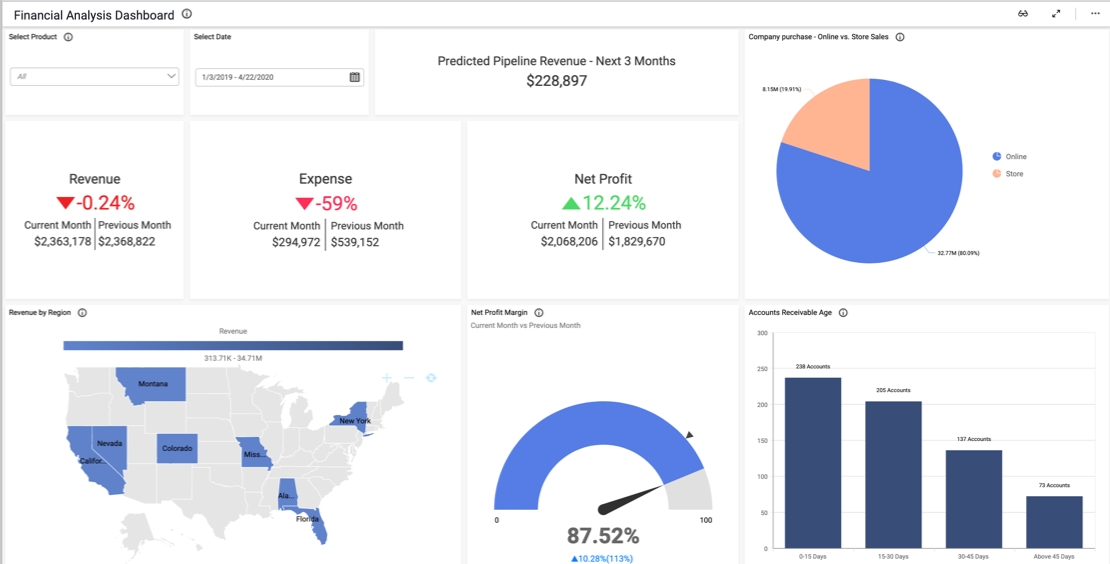
Similarly, with the in-store and online orders card widgets, we can not only view this month’s figures but can compare them to last month’s. This information can help the team ensure they are on track to meet their goals. Further, it can help management ensure that resources and staff are allocated appropriately. For example, if most sales are online orders, more staff will be needed in warehouses, and shipping costs may need to be factored into the company’s financial plans.

The product revenue bar chart quickly and clearly illustrates which products are the most profitable. Finally, the inventory turnover ratio offers insight into demand for the company’s products and how well it is managing its stock. If turnover is low, leaders will need to make adjustments to increase sales and decrease the cost of storing unsold goods.

Filter Your Data

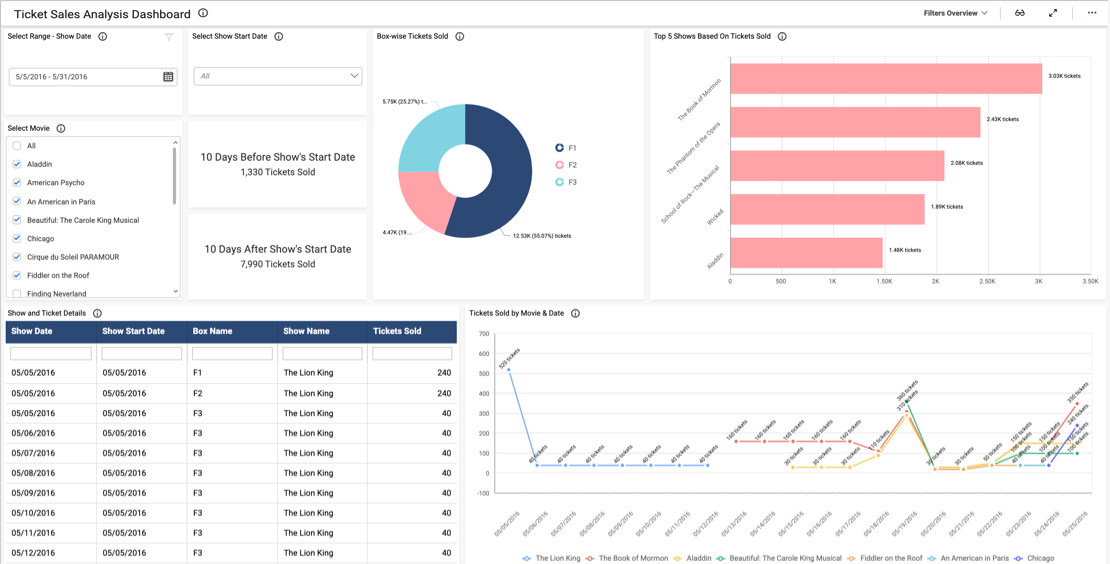
One key feature of this dashboard is its versatility. With the “Products” drop-down list box filter, viewers can display data for any combination of products sold. Users can reset the filter by clicking the funnel-shaped icon in the upper right corner of the list box. This feature is invaluable for users who need to focus their analysis on specific pieces of data.


Access live 30-minute demo with our experts

Sales Dashboard Examples

Northwind Products and Suppliers Dashboard

This sales dashboard lists orders placed with the fictitious supply company Northwind Traders. 

Financial Analysis Dashboard
This financial analysis dashboard provides a helpful overview of a company’s key financial metrics.
Northwind Products and Suppliers Dashboard
This sales analysis dashboard provides a detailed breakdown of a company’s sale.
Ticket Sales Analysis Dashboard
This ticket sales analysis dashboard provides a detailed breakdown of key data sets.
Revenue Analysis Dashboard

This financial analysis dashboard provides a helpful overview of a company’s key financial metrics.

Financial Analysis Dashboard

This sales KPI dashboard provides a detailed breakdown of a company’s key metrics.

Salesforce Opportunity Dashboard

This Salesforce opportunity dashboard provides an overview of a company’s sales outlook.

Sales Activity Tracker Dashboard

This sales activity tracker dashboard displays key data sets relating to ticket sales. 

Sales Manager Summary Dashboard

This sales manager summary dashboard provides a detailed breakdown of a company’s revenue details, leads, and sales pipeline. With this dashboard…

Sales Leads Tracking Dashboard

This sales leads tracking dashboard provides a detailed breakdown of a company’s lead and account details. With this dashboard…

Sales Opportunities Dashboard

This sales opportunities dashboard provides a detailed breakdown of a company’s opportunities and revenue. With this dashboard…

Sales Activities Dashboard

This sales activities tracker dashboard provides a detailed breakdown of a sales team’s work. With this dashboard, we can answer…

We'll help you find the best solution for you

Up arrow icon
Live Chat Icon For mobile
Hugo Morris

Chat with the Smart Dashboard Sales team now!

Live Chat Icon