

Solutions for Support
Simplify your support operations by tracking incident statuses, time to resolution, and more


As a support professional, you need to track various sets of data in order to ensure operations run smoothly. On one hand, you need to track closed and resolved tickets. At the same time, you need to review newly opened tickets to make sure they are addressed. Also, you need to track your team’s average time to resolution. With this data, you can work more efficiently, prioritize tasks, and provide a positive experience for your customers.
KPIs can help you achieve your goals and ensure your company’s long-term success. No matter your industry, with key data sets, you can better understand your team’s strengths and weaknesses, assess customers’ needs, and guide leaders’ decisions.
Whether you need to track initial response times or analyze the average time between incidents, Smart Dashboard can help. Check out our support dashboard examples to learn more. Then, request a demo for a complete product walkthrough.
Access live 30-minute demo with our experts
Support Dashboard Examples

This call tracking dashboard provides an overview of key call and message details. With this dashboard…

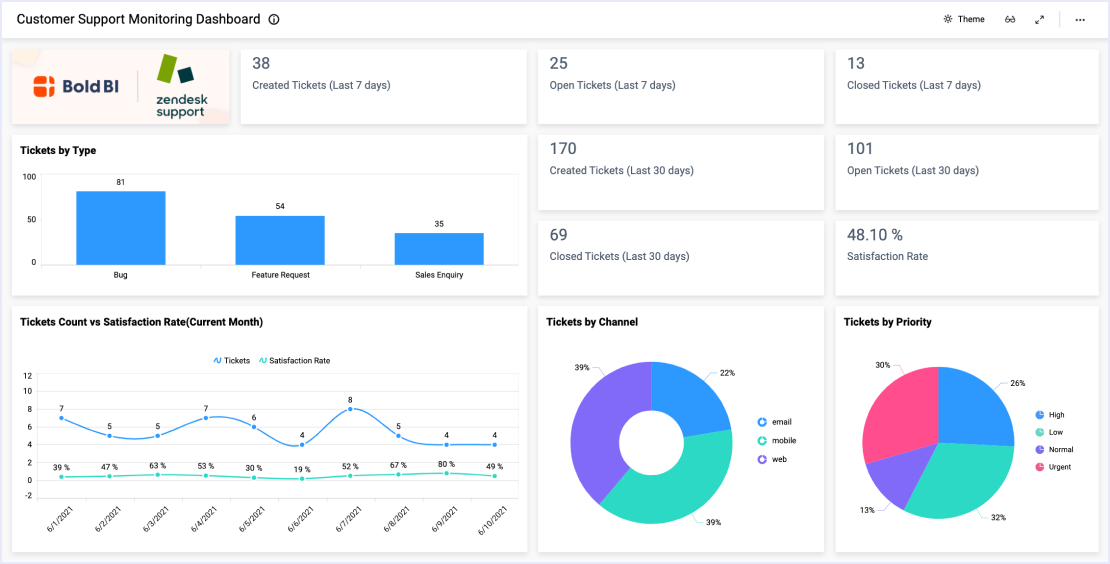
This Zendesk support monitoring dashboard displays key support ticket metrics. With this dashboard…
Smart Dashboard for Support – Common Metrics
With Smart Dashboard’s user-friendly, customizable dashboards, you can track all the KPIs your team depends on:
- Average resolution time
- Average initial response time
- Time spent on-call
- Average time between incidents
- Ticket reopen rate

