Northwind Products and Suppliers

Track sales by region, average revenue per unit, and more.

Smart Dashboard Northwind Products and Suppliers Dashboard

This sales dashboard lists orders placed with the fictitious supply company Northwind Traders. With this dashboard, we can answer the following questions:

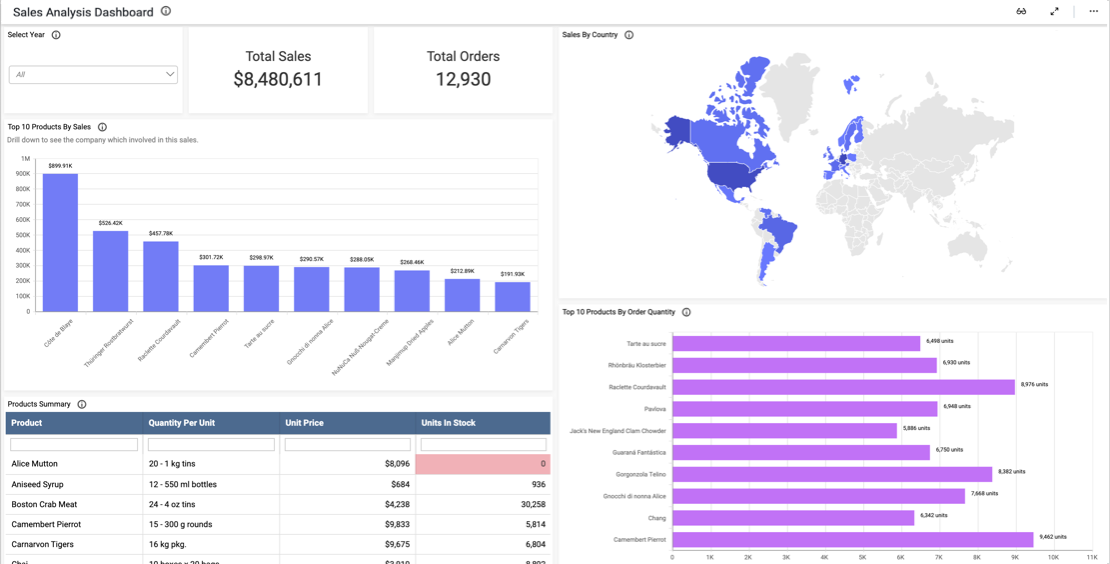
  • Firstly, what is our overall sales number?
  • How much have we sold of each product?
  • Which products are our best and worst sellers?
  • Which of our clients order the most products? What do they order?
  • How do our sales look when broken down by region?

Analyze Trends to Meet Customer Needs

By reviewing metrics such as the product categories with the most and least sales, leaders can ensure that they have sufficient inventory to meet customer demand. These bar charts are especially useful because they use the multi-level drill down feature. Just click a category’s bar to view a detailed breakdown of the products that make up that category and the total dollar amount of sales for each product.

The bar charts tracking maximum and minimum customer orders also utilize this feature. For example, by clicking the bar representing Specialty Biscuits, Ltd., we can see that the company ordered marmalade, bread, chocolate biscuits, and scones.

This data allows the supplier to ensure that their inventory matches customer demand.

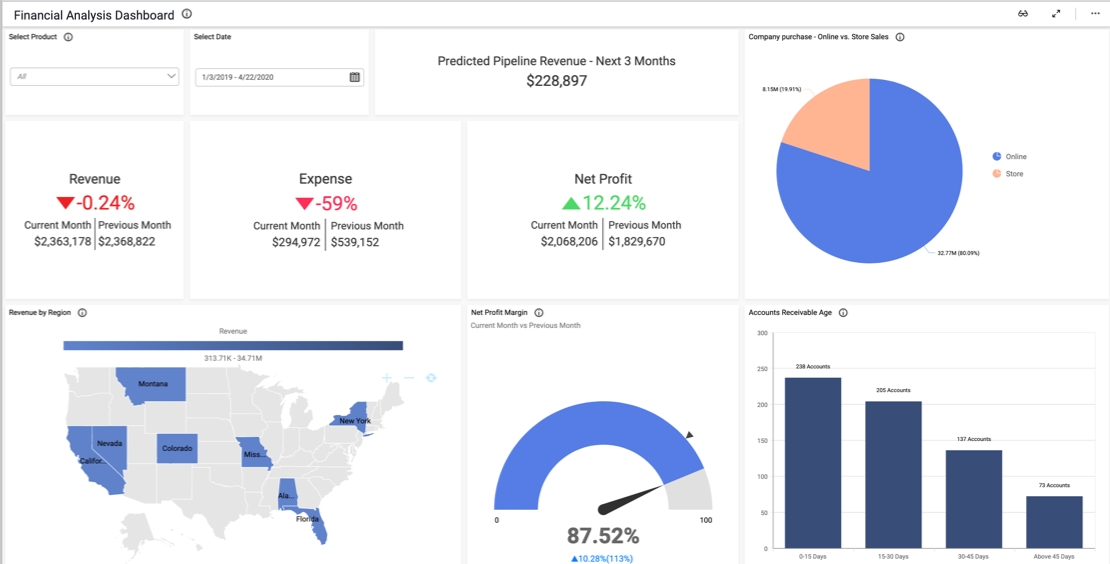
Finally, the map illustrating customers’ locations could help the company focus their marketing efforts. It could also help them estimate shipping costs for their products.

Filter Your Data

One key feature of this healthcare dashboard is its versatility.  With the “Product Category” drop-down list box filter, viewers can display data for any combination of categories. Then, users can reset the filter by clicking the funnel-shaped icon in the upper right corner of the drop-down list box.

This feature is invaluable for users who would like to focus their analysis on a specific set of products.

Access live 30-minute demo with our experts

Sales Dashboard Examples

Sales Performance Dashboard

Smart Dashboard’s sales performance dashboard provides a detailed breakdown of key data sets.

Ticket Sales Analysis Dashboard
This ticket sales analysis dashboard provides a detailed breakdown of key data sets.
Financial Analysis Dashboard
This financial analysis dashboard provides a helpful overview of a company’s key financial metrics.
Northwind Products and Suppliers Dashboard
This sales analysis dashboard provides a detailed breakdown of a company’s sale.
Revenue Analysis Dashboard

This Infusionsoft dashboard provides a detailed breakdown of a company’s recent orders. 

Financial Analysis Dashboard

This sales KPI dashboard provides a detailed breakdown of a company’s key metrics.

Salesforce Opportunity Dashboard

This Salesforce opportunity dashboard provides an overview of a company’s sales outlook.

Sales Activity Tracker Dashboard

This sales activity tracker dashboard displays key data sets relating to ticket sales. 

Sales Manager Summary Dashboard

This sales manager summary dashboard provides a detailed breakdown of a company’s revenue details, leads, and sales pipeline. With this dashboard…

Sales Leads Tracking Dashboard

This sales leads tracking dashboard provides a detailed breakdown of a company’s lead and account details. With this dashboard…

Sales Opportunities Dashboard

This sales opportunities dashboard provides a detailed breakdown of a company’s opportunities and revenue. With this dashboard…

Sales Activities Dashboard

This sales activities tracker dashboard provides a detailed breakdown of a sales team’s work. With this dashboard, we can answer…

In the hospitality industry, you need to be able to monitor everything…

In the information technology field, you need to be able to monitor everything…

From evaluating claim settlement times to analyzing customer satisfaction…

We'll help you find the best solution for you

Up arrow icon
Live Chat Icon For mobile
Hugo Morris

Chat with the Smart Dashboard Sales team now!

Live Chat Icon