Sales Analysis

Track total sales, total orders, sales by country, and more.

Smart Dashboard Sales Analysis Dashboard

This sales analysis dashboard provides a detailed breakdown of a company’s sales. With this dashboard, we can answer the following questions:

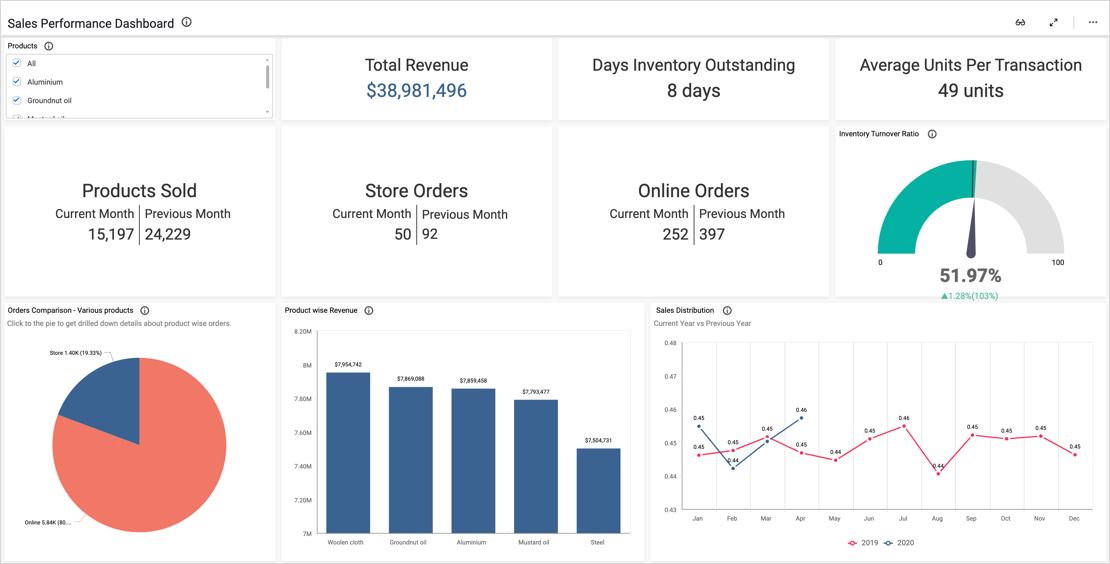
  • Firstly, what are our total sales numbers by dollar amount?
  • Secondly, what are our total sales by unit?
  • Which products are top sellers?
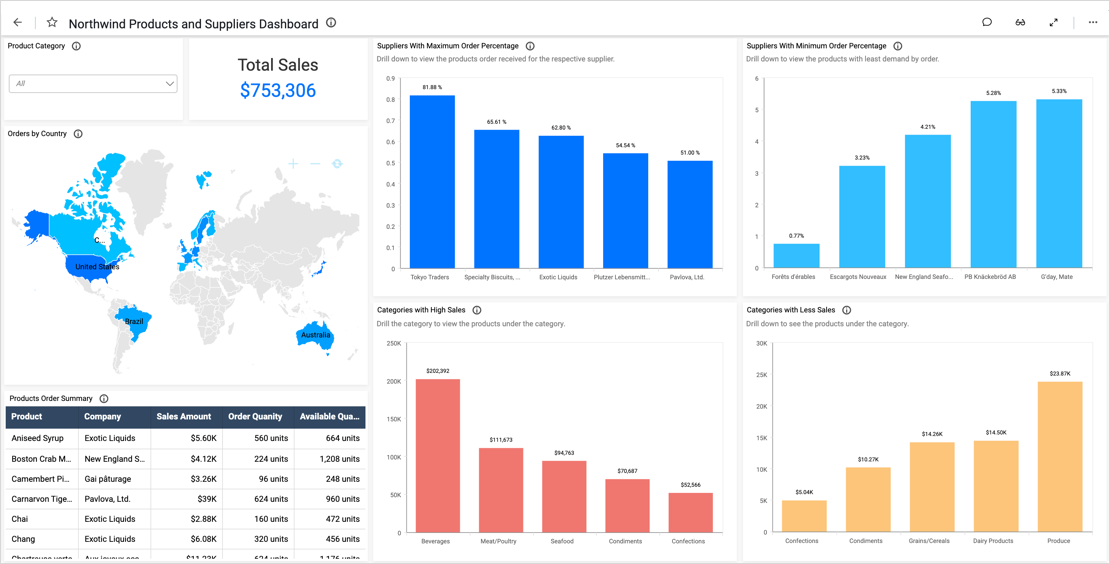
  • Finally, how do sales break down by country?
 

Analyze Order Details

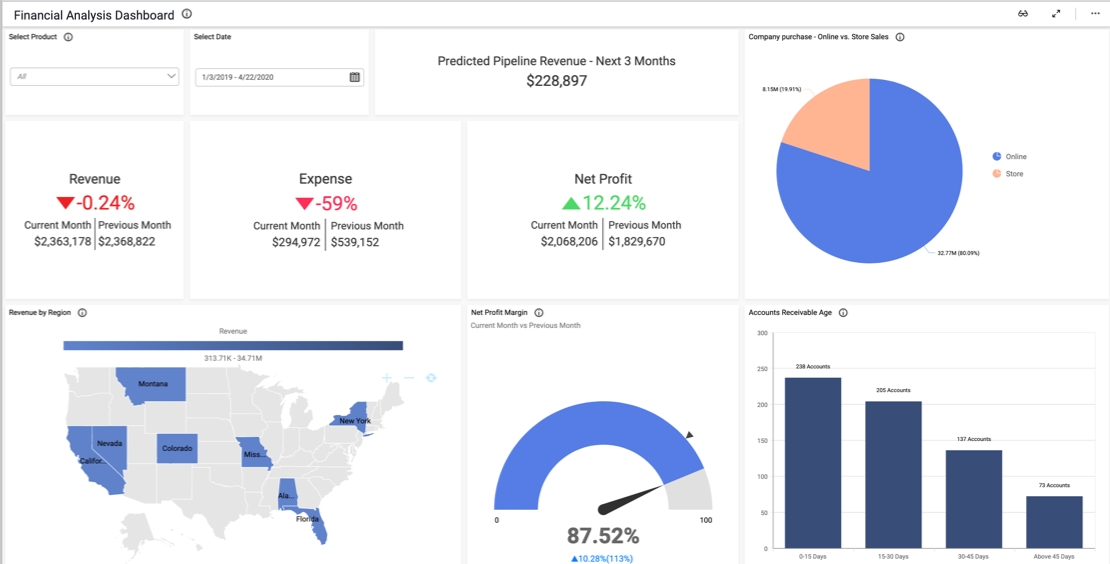
By reviewing sales by both dollar amount and order amount, leaders can ensure that teams are achieving their big-picture sales goals. They can also make sure their inventory matches customers’ needs. Further, monitoring sales by country can help marketing and sales teams decide where to focus their outreach efforts. 

It is also worth noting that the dashboard’s two bar charts use the multi-level drill down feature. By clicking on a bar, users can view a more detailed breakdown of its data. For instance, by clicking the tarte au sucre bar on the sales bar chart, I can see all of the companies that purchased the item and the dollar amounts of their orders. Similarly, by clicking the same bar on the order quantity bar chart, I can see how many units each company purchased.

Finally, the Product Summary grid notes the size and price of each unit, along with the number of units in stock. This widget is especially useful as it is easily searchable with the text boxes at the top of each column.

Filter Your Data

 
One key feature of this dashboard is its versatility. With the “Select Year” drop-down list box filter, viewers can display data for any combination of the three years for which we have data. Users can reset the filter by clicking the funnel-shaped icon in the upper right corner of the list box. This feature is invaluable for users who need to focus their analysis on specific sets of data.


Access live 30-minute demo with our experts

Sales Dashboard Examples

Sales Performance Dashboard

Smart Dashboard’s sales performance dashboard provides a detailed breakdown of key data sets.

Northwind Products and Suppliers Dashboard

This sales dashboard lists orders placed with the fictitious supply company Northwind Traders. 

Financial Analysis Dashboard
This financial analysis dashboard provides a helpful overview of a company’s key financial metrics.
Ticket Sales Analysis Dashboard
This ticket sales analysis dashboard provides a detailed breakdown of key data sets.
Revenue Analysis Dashboard

This financial analysis dashboard provides a helpful overview of a company’s key financial metrics.

Financial Analysis Dashboard

This sales KPI dashboard provides a detailed breakdown of a company’s key metrics.

Salesforce Opportunity Dashboard

This Salesforce opportunity dashboard provides an overview of a company’s sales outlook.

Sales Activity Tracker Dashboard

This sales activity tracker dashboard displays key data sets relating to ticket sales. 

Sales Manager Summary Dashboard

This sales manager summary dashboard provides a detailed breakdown of a company’s revenue details, leads, and sales pipeline. With this dashboard…

Sales Leads Tracking Dashboard

This sales leads tracking dashboard provides a detailed breakdown of a company’s lead and account details. With this dashboard…

Sales Opportunities Dashboard

This sales opportunities dashboard provides a detailed breakdown of a company’s opportunities and revenue. With this dashboard…

Sales Activities Dashboard

This sales activities tracker dashboard provides a detailed breakdown of a sales team’s work. With this dashboard, we can answer…        

In the hospitality industry, you need to be able to monitor everything…

In the information technology field, you need to be able to monitor everything…

From evaluating claim settlement times to analyzing customer satisfaction…

We'll help you find the best solution for you

Up arrow icon
Live Chat Icon For mobile
Hugo Morris

Chat with the Smart Dashboard Sales team now!

Live Chat Icon