

Smart Dashboard for Time Series Analysis
Forecast revenue and expenses by looking at historical trends. Use your data to forecast trends, recognize seasonal variations, and more.


With time series analysis, you can recognize patterns, forecast trends, and analyze seasonal changes to your data. This can help you better understand the factors that influence your data.
Forecasting in Smart Dashboard
Now, you can use Smart Dashboard to predict trends in your data. Our exponential smoothing model uses the weighted average of past data points to forecast future outcomes.
Time Series Analysis in Industries
- ENERGY
- MANUFACTURING
- MARKETING
- RETAIL
- TRANSPORTATION
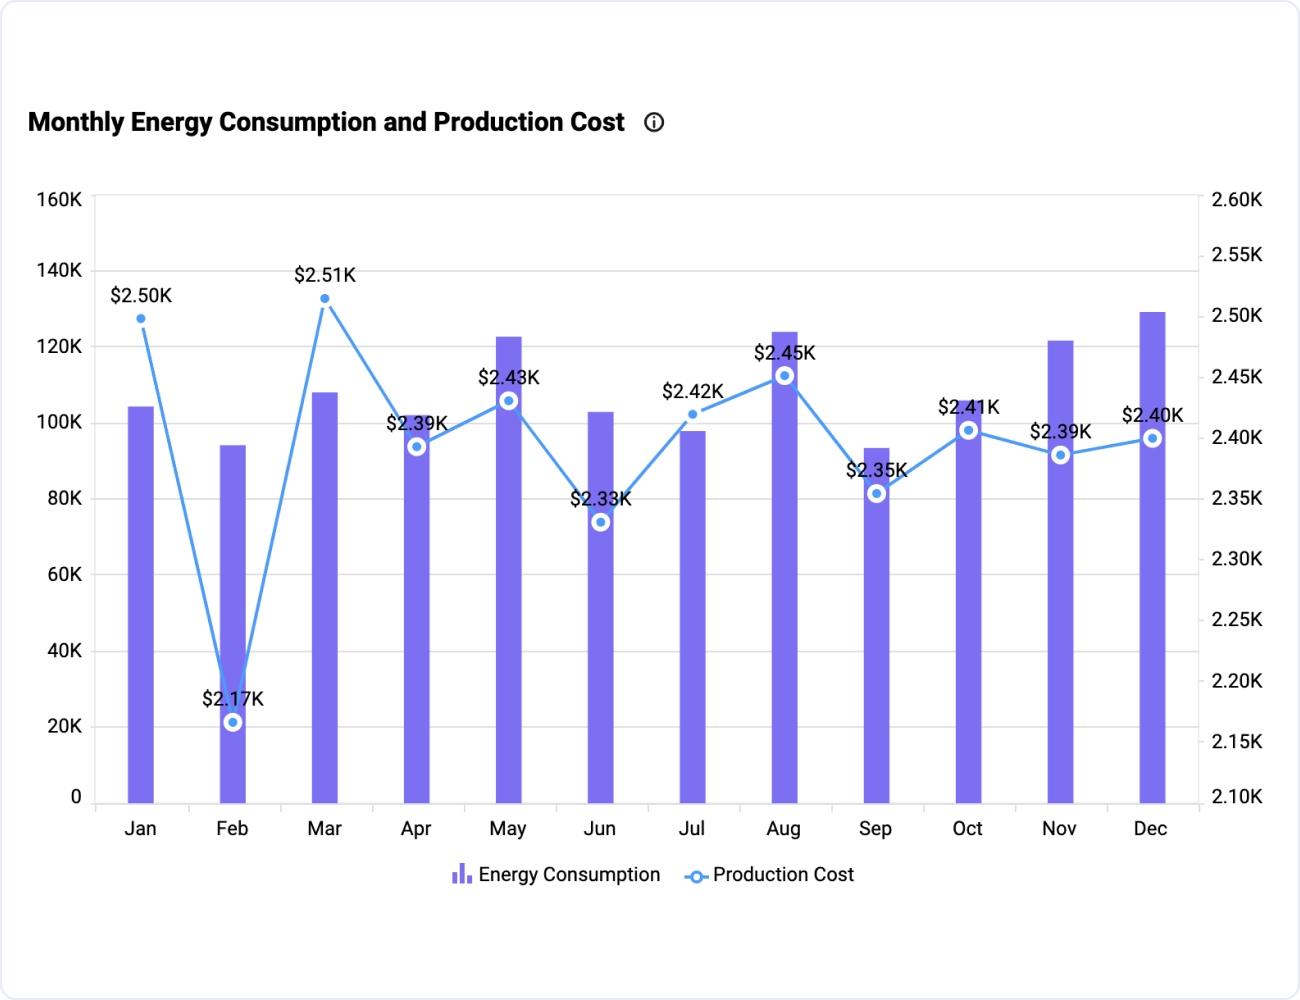
Energy consumption
With seasonal changes in temperature, consumer travel, and more, energy consumption and production costs can vary greatly. Time series analysis can help your team ensure you’re prepared to adapt to customers’ changing needs and meet their energy demands.

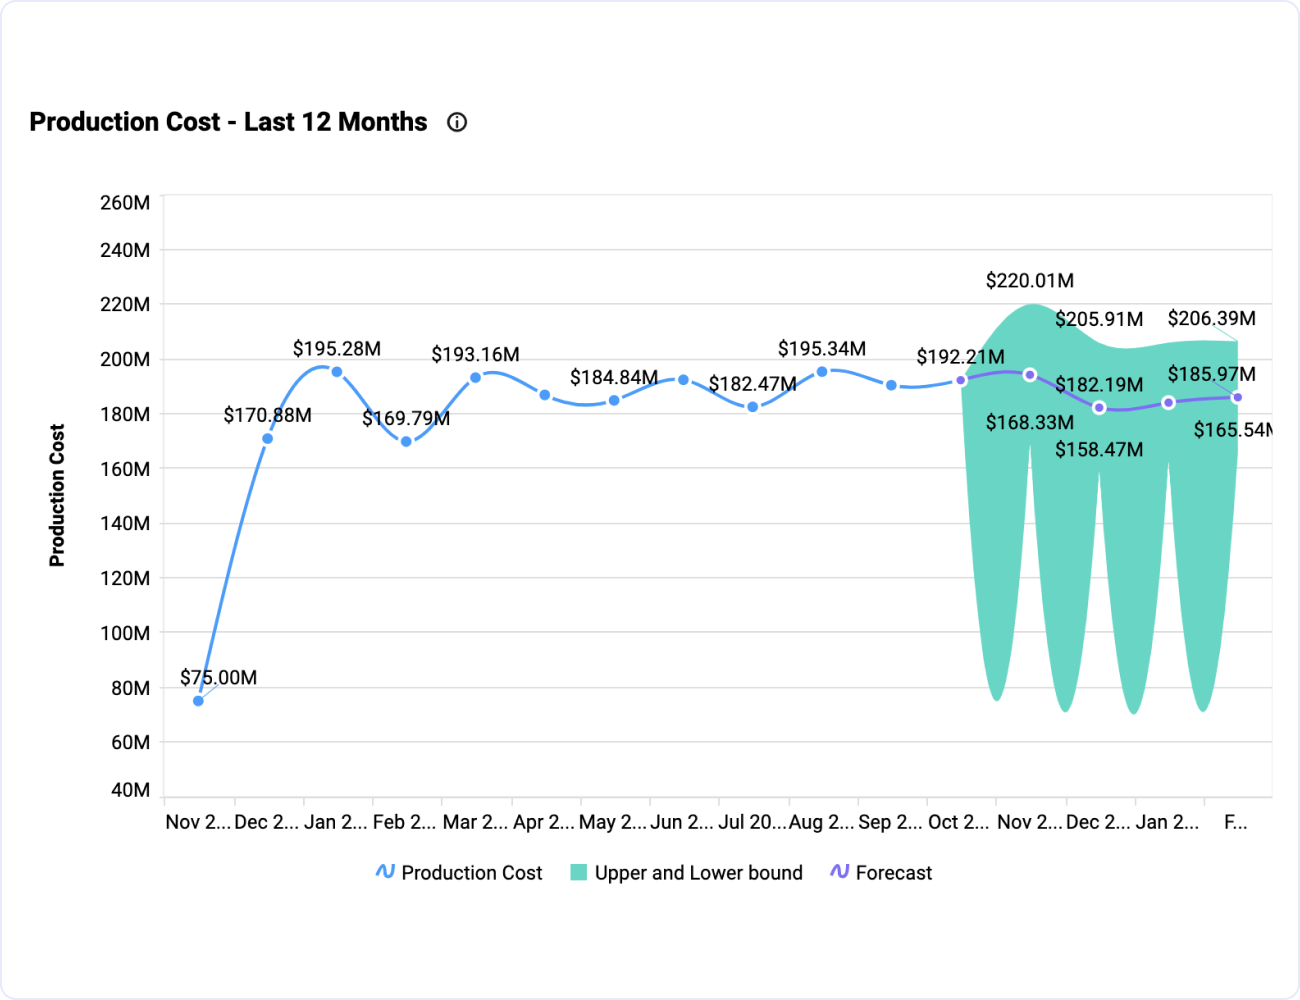
Production Cost
In the manufacturing industry, you need to meet production goals while reducing rework, repairs, and labor costs. Use time series analysis to predict your plant’s equipment and personnel needs, reducing production and overtime costs by ensuring you’re prepared to meet customers’ needs.

Website User Interactivity Metrics
Marketing teams need to track various KPIs, including metrics relating to website user interactivity and seasonal variations in user activity. With time series analysis, marketing professionals can create action plans to reduce bounce and dormancy rates and increase their search engine rankings.


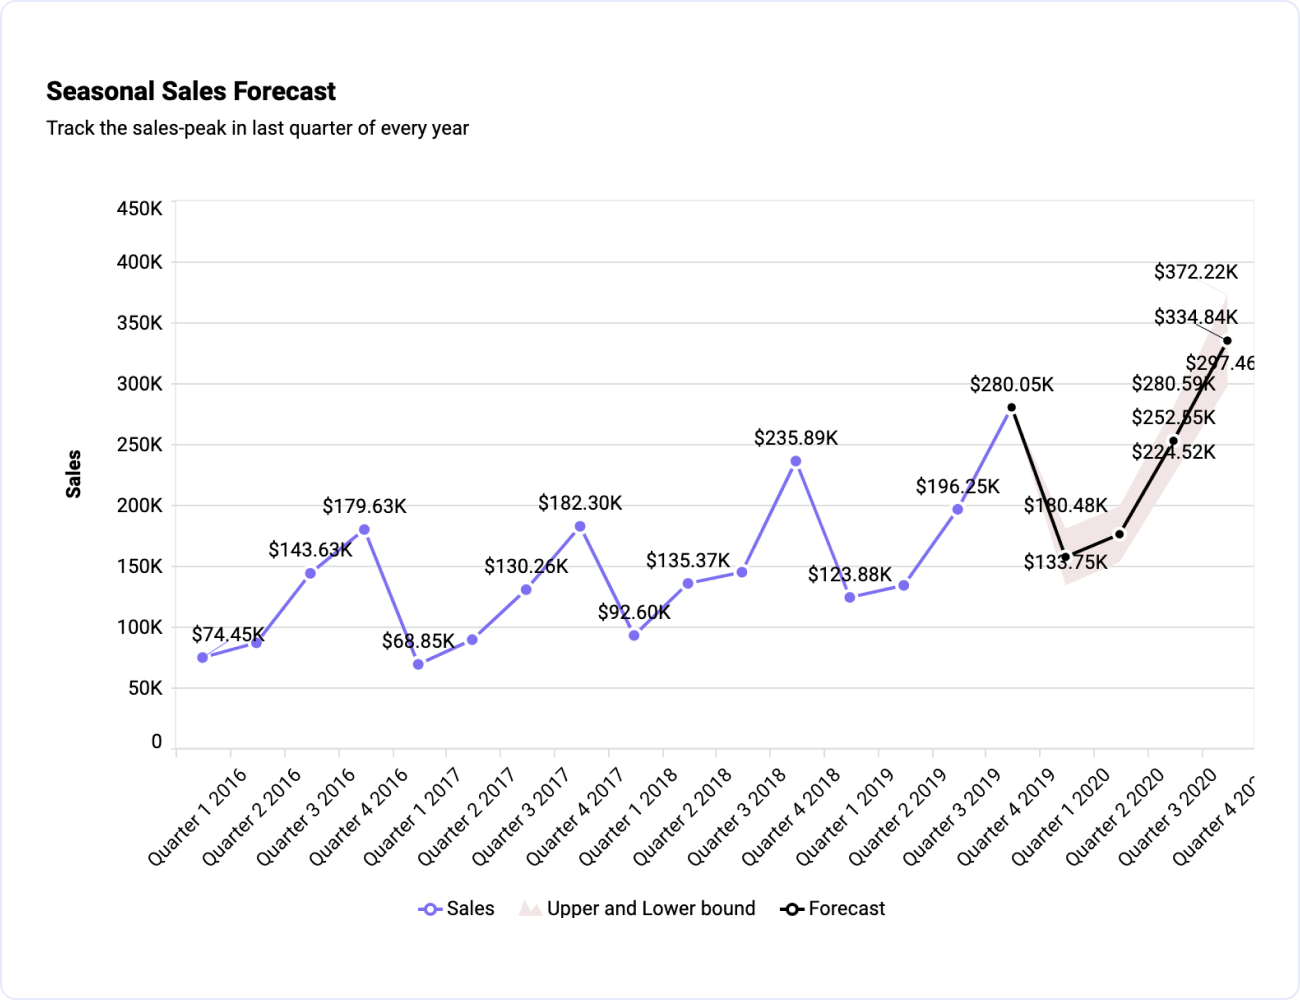
Seasonality Time Series
As retail sales fluctuate throughout the year, companies need to produce accurate sales forecasts to ensure they can meet consumer demand. For instance, as this graph illustrates, sales typically peak in the fourth quarter of each year, sparked by holiday discounts.

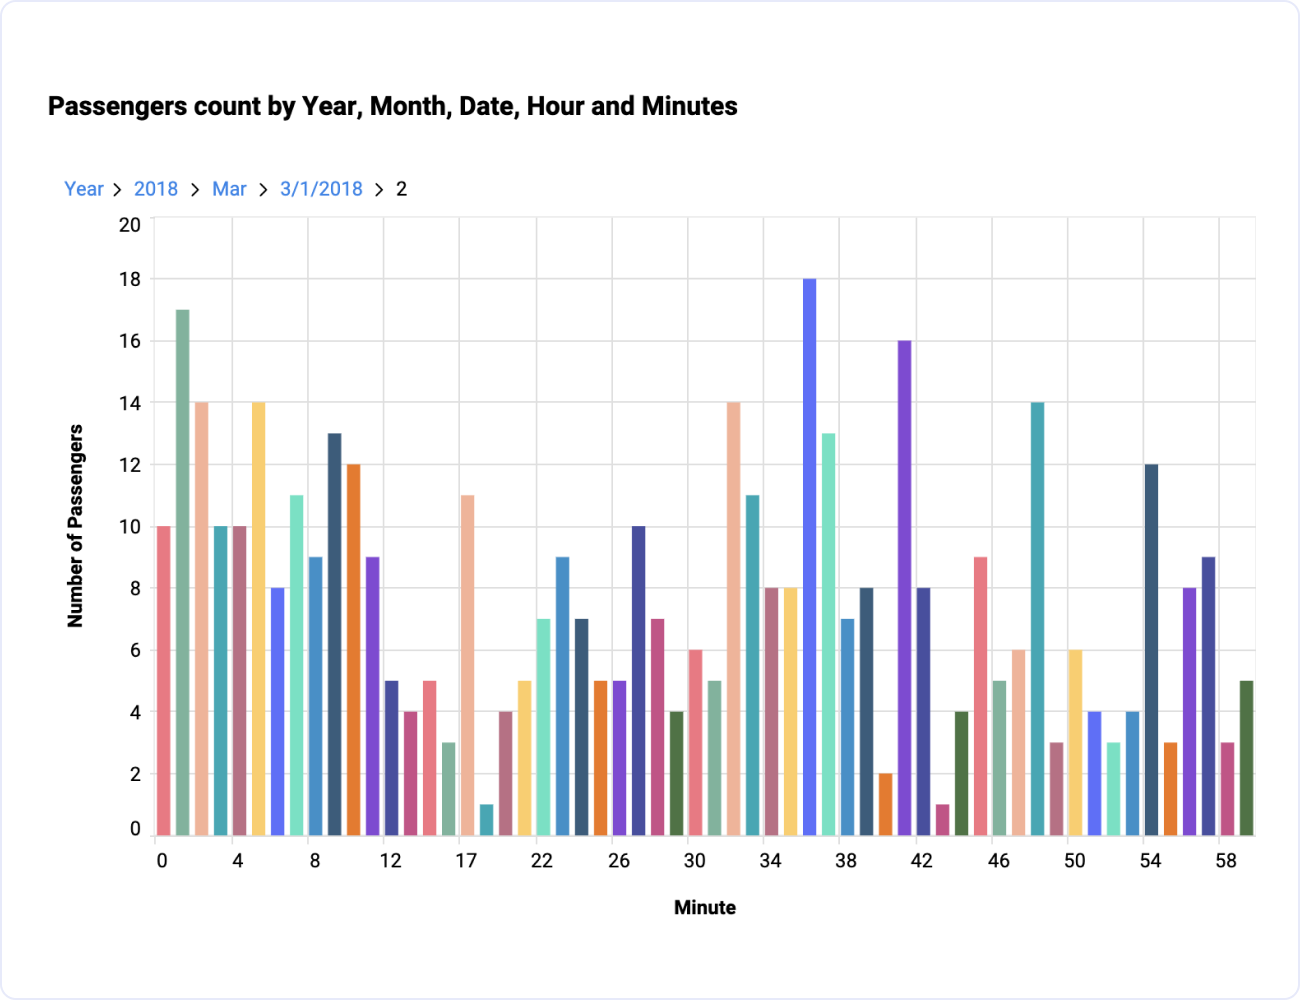
Cab Booking
Accurately forecasting customer demand is critical in the transportation industry. For example, time series analysis can help companies plan taxicab and driver availability. Plus, with Smart Dashboard’s drill-down feature, you can view even more detailed breakdowns of your data with a simple click.

Time Series Analysis in Departments
- FINANCE
- INFORMATION TECHNOLOGY
- INSURANCE
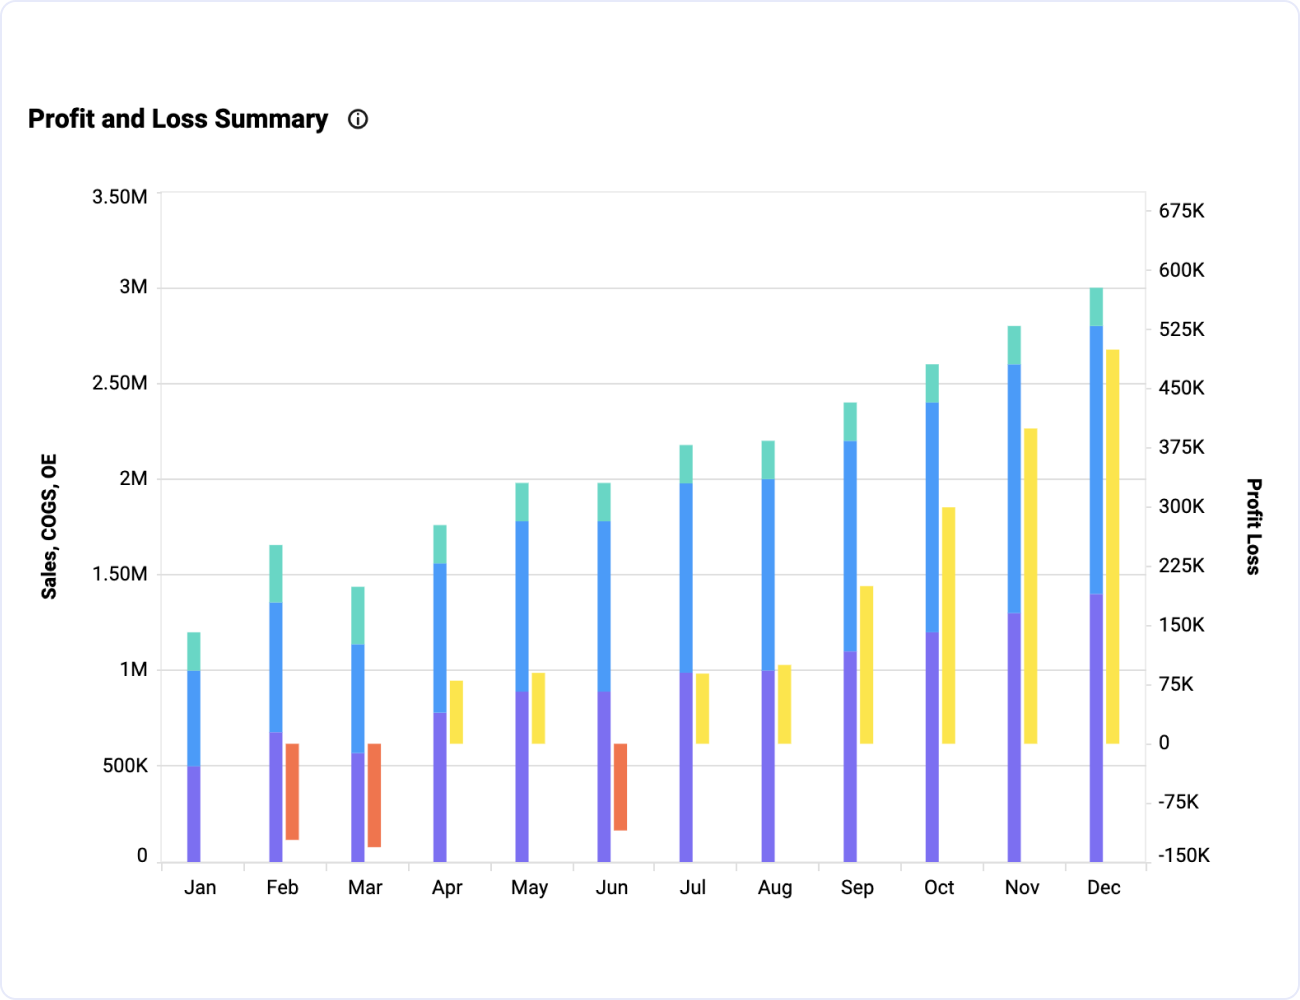
Profit & Loss Summary
For financial professionals, tracking profits and losses is critical—this data is the basis for all the decisions a company makes. With time series analysis, you can analyze multiple financial data points by month, empowering your team to make data-driven decisions.

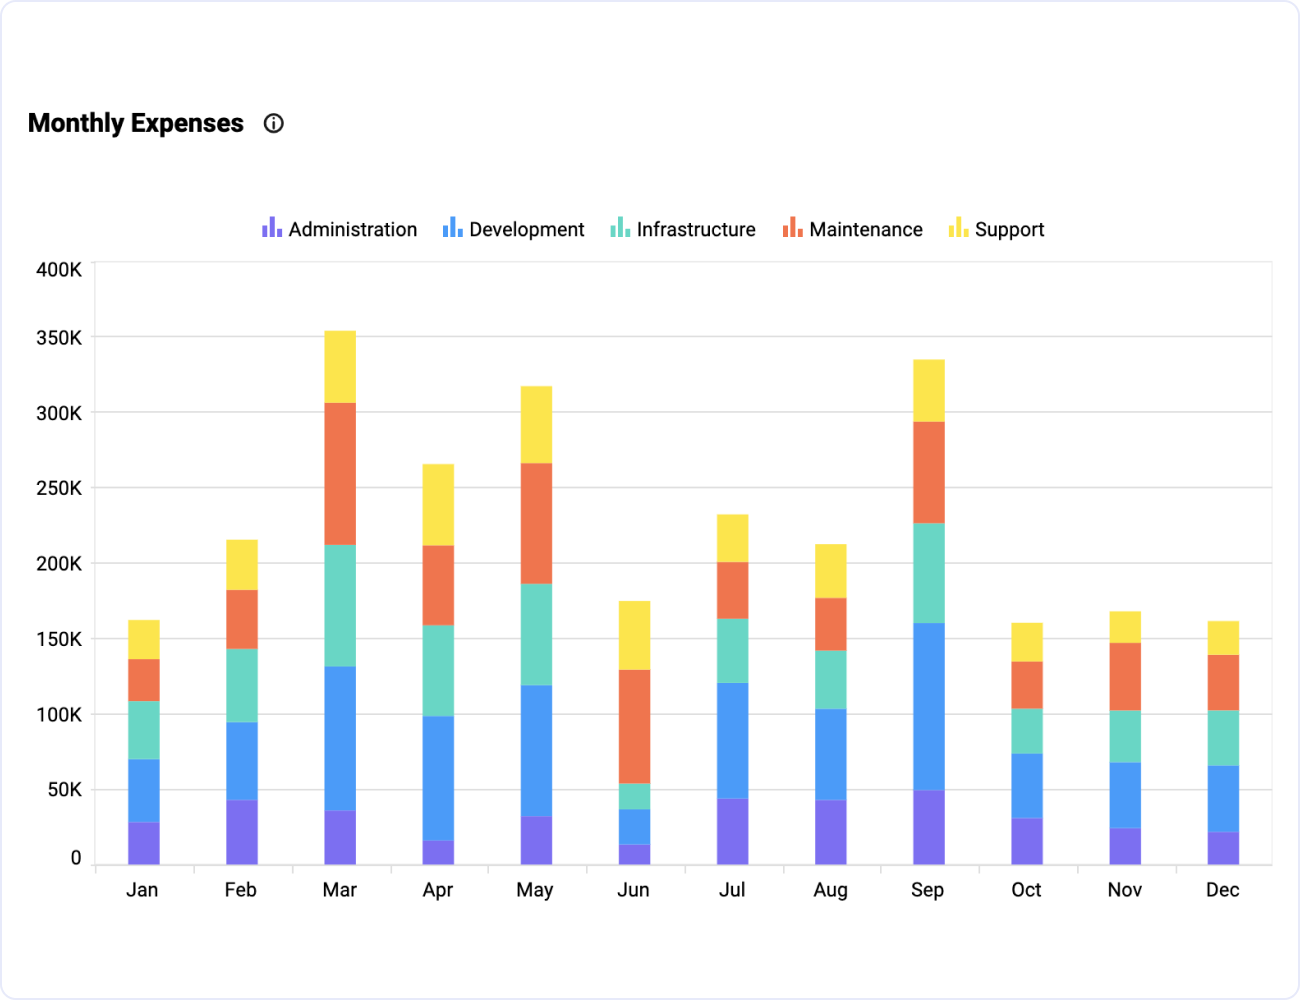
Project Monthly Expenses
In the information technology industry, it is crucial for each department to track project costs. For example, with a stacked view widget such as a bar chart, you can easily compare monthly expenses such as administrative, development, infrastructure, maintenance, and support costs.

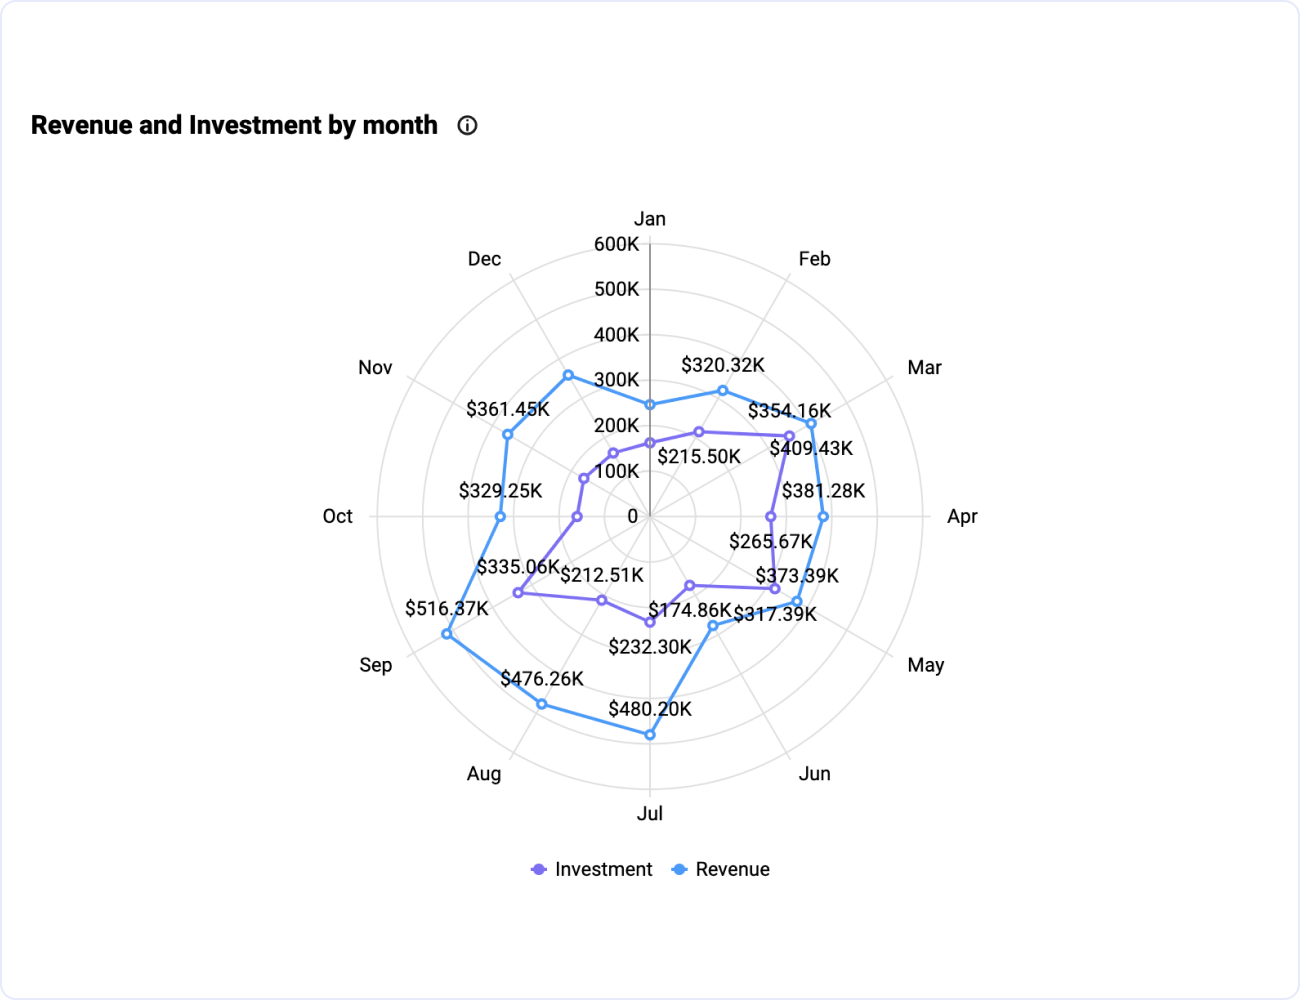
Revenue vs Investment comparison
Time series analysis can help IT teams analyze the revenue earned versus the expenses invested in a project. For instance, with a polar bar chart, you can conveniently view the revenue and expenses for each month of a project in a single widget.

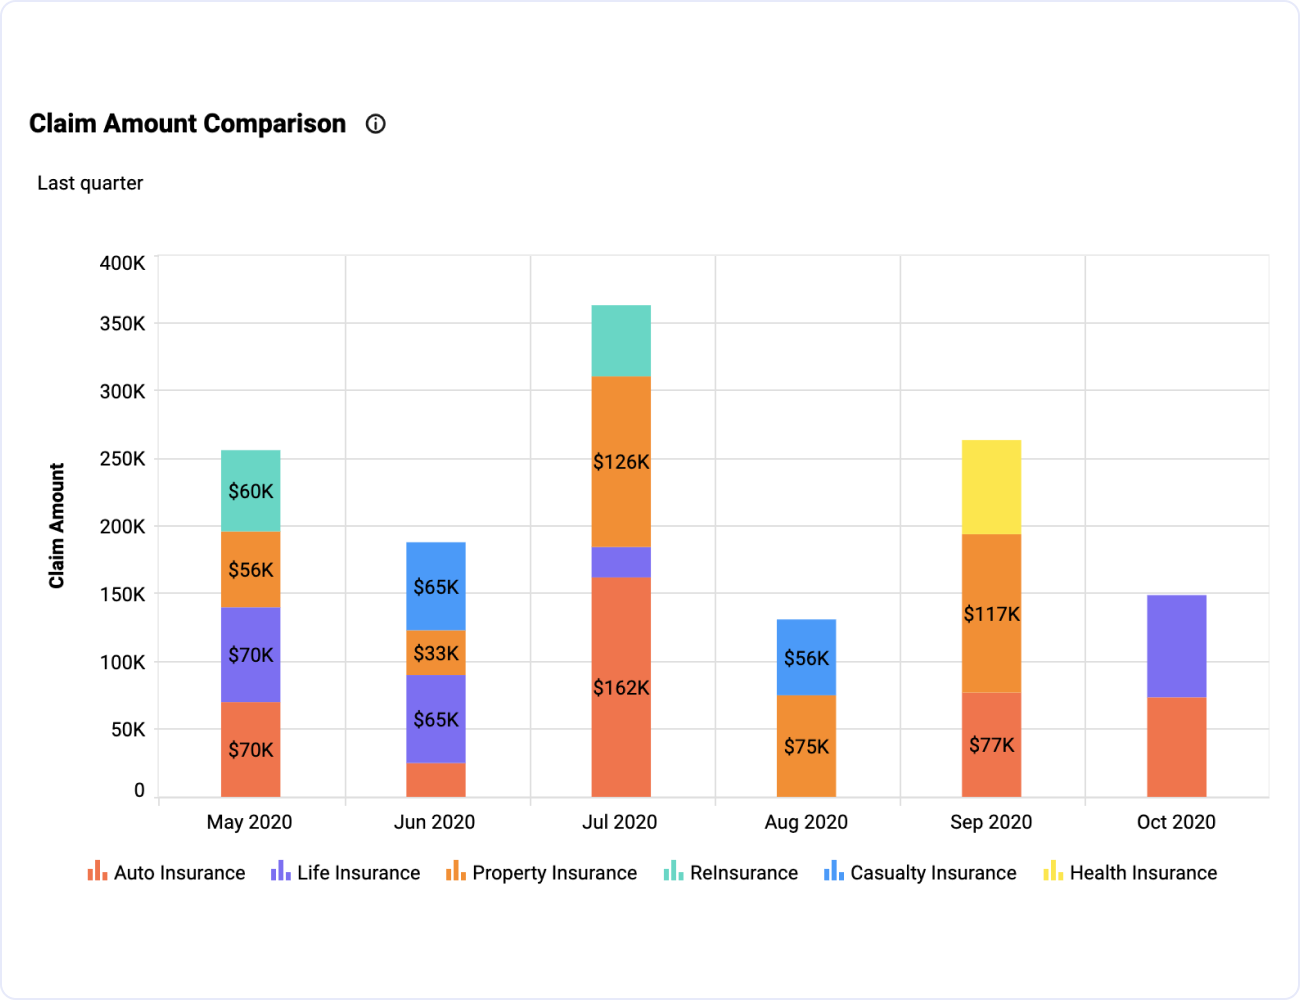
Claim Amount Analysis
In the insurance industry, seasonal variations in the weather, travel habits, and more can cause significant changes to the claims that customers file. Use time series analysis to analyze claim amounts, determine when certain claims are likely to be filed, and track costs.

Access live 30-minute demo with our experts
Smart Dashboard for Time Series Analysis – Common Metrics
With Smart Dashboard’s user-friendly, fully customizable dashboards, you can track all the key performance indicators that your team depends on:
- Sales forecasts
- Projected revenue
- Production costs
- Inventory projections
- Consumer utility demands (such as energy consumption and water use)
- Website activity metrics

