

Solutions for Retail Industry
Monitor inventory and product sales in retail markets through key metrics. Empower retailers to focus on increasing ROI through the adoption of modern techniques such as personalization.


Dashboard solutions for the retail industry are essential for decision makers to analyse the metrics related to revenue and inventory. Consequently, data analysis allows them to take firm decisions in-spite of demand and supply fluctuations. Such, fluctuations may be due to weather, geographic locations, social media hypes and more.
Store managers use KPIs like average basket size, average unit in retail, sales per sq. ft. and average basket value. In addition, they also track net sales, and profit margin details by product category and by store. Similarly, inventory managers track KPIs like inventory turnover ratio, gross margin ROI apart from purchase orders, and stock availability of each item. Above all, Smart Dashboard’s retail dashboards allows you to access all such retail KPIs in one place.
Drilled-down store-wise revenue analysis lets decision makers decide on future investments and store improvisation plans. Net sales and gross profit by product category allows to decide which category provides higher profit despite less sales volume.
Meanwhile, retail managers ensure that necessary products are available in all stores. This is to avoid situations like out-of-stock for customers or overstock for managers. In short, monitoring top-selling items and ensuring their availability helps inventory managers give assurance for orders placed by store managers requesting those items.
In short, check out our sample retail dashboards to learn more about how we can help your retail store to grow and reach great heights.
Access live 30-minute demo with our experts
Retail Dashboard Examples

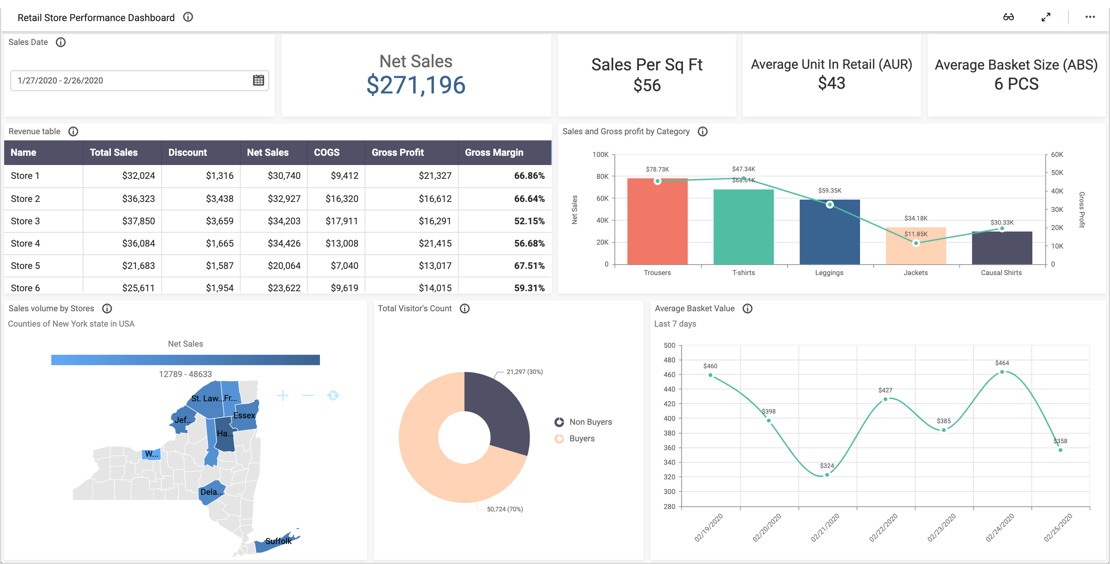
Smart Dashboard’s retail store performance dashboard provides a complete overview of sales happening in brick-and-mortar stores located in different counties of New York state…

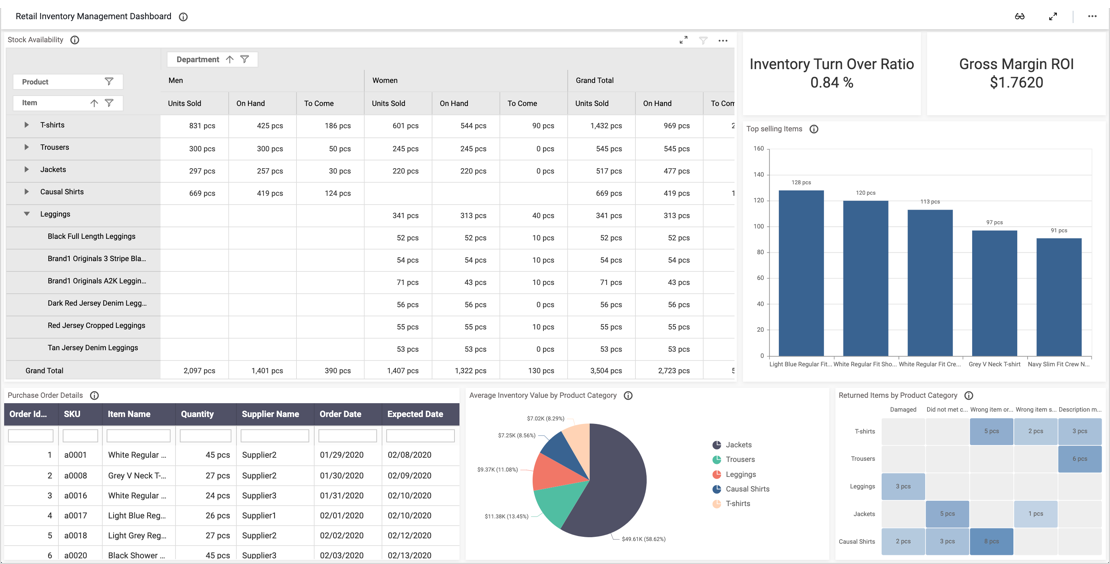
This dashboard from Smart Dashboard gives you an overview of inventory management in the retail industry that helps to manage right products at the right time in the right store…
Smart Dashboard for the Retail Industry – Common Metrics
With Smart Dashboard’s user-friendly, fully customizable, interactive dashboards, you can track all the key performance indicators that retail industry experts depend on:
- Total sales, COGS and net sales for a selected period and selected store.
- Visitors and buyers count in different stores.
- Sales metrics like AUR, sales per sq. ft.
- Summarized data about stock availability.
- Purchase order tracking based on expected date.
- Average inventory value by product category.

