


- What is our revenue, and what are our expenses?
- How many orders are placed online and through our mobile app?
- What are our busiest days?
- What are our delivery times for each restaurant?
- Finally, are customers happy with our service?
Predict Revenue and Customer Needs
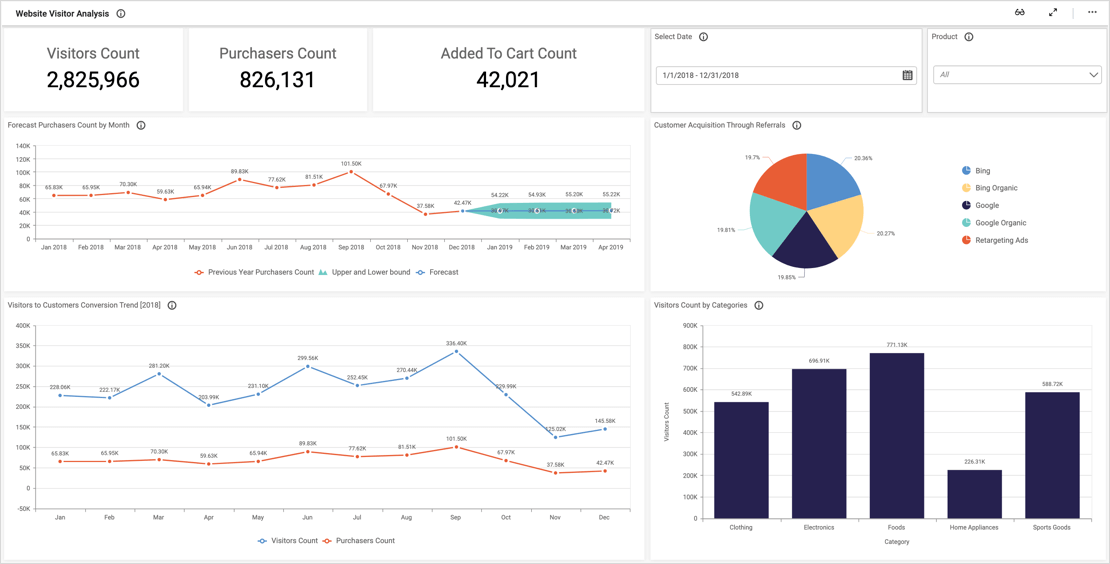
The dashboard’s revenue forecast chart supplies a monthly breakdown of anticipated revenue. This information is crucial for several reasons. For example, it can help the company ensure they allocate resources appropriately during months that are likely to be busy. Further, it could encourage them to strengthen advertising efforts or offer discount codes to customers to boost sales during months that are projected to be less busy. Finally, it allows leaders to plan for future growth.
Similarly, the “Total Orders by Week day” spline chart and “Delivery Time” bar graph show which days of the week are busiest for the delivery service and each restaurant’s average delivery time. This data can help the company ensure that they have enough drivers on busy days, especially if some restaurants’ customers experience longer wait times.
Track Orders, Delivery Times, and Customer Satisfaction
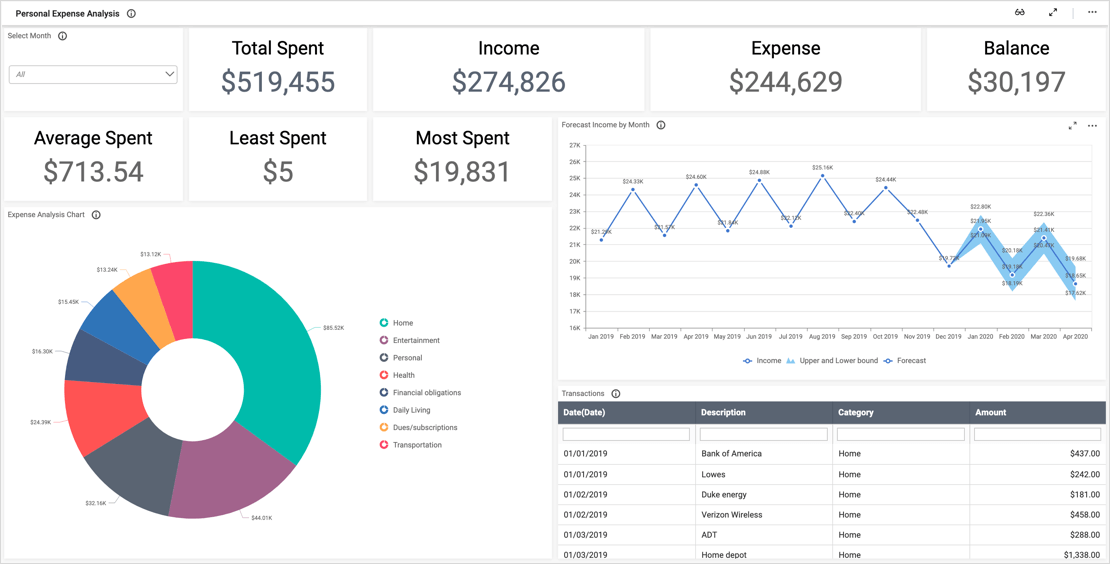
The dashboard’s data allows viewers to plan for the future. However, it also offers insight into daily operations.
For example, the “Mobile App vs Website Orders” chart shows that most people prefer to use the app. Thus, the company might wish to focus their development efforts on the app.
Finally, the customer satisfaction doughnut chart offers insight into customer experience. This could be cross-referenced with other data to see whether correlations might exist. For example, the service might wish to track whether increased satisfaction ratings correspond with decreased delivery times.
Having all of this data on a single dashboard is key for team members who need an overview of financial metrics but also want to track sales and customer service trends that occur over time.